Garbage Collection kills the Java Application.
Being in Java world, loading 100G of data on java heap sounds crazy. I did some experiments to load 100G of data on single JVM. Even for Read-only case (no writes/updates to reduce the GC problems), it wont fit in 150G of heap.
On tuning GC, reducing Young Gen Space, reducing Survivor Ratio, etc, didnt helped much. The test just gets into back-to-back full GCs, killing the application throughput and latency. To get it working had to give 200 GB of heap and it performed so badly.
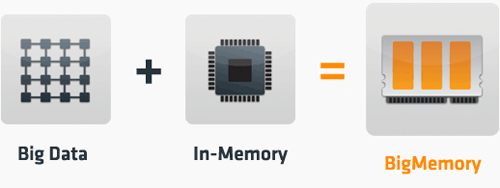
Then I wished, wont it be really nice to fit whole data, without any GC problems. "Terracotta Fairy" listened to us and here we have BigMemory Ehcache. BigMemory is a GC murder weapon from Terracotta, like an AA12 ShotGun.
Now, we can store 350GB of data with no GC .
Can you believe this !! Literally NO GC!!
Wanna see it with your eyes, here are the charts from the battle of Troy - On-Heap vs BigMemory.
The following charts shows the Ehcache use case which I thought would be fair enough. Ehcache being most widely used Java cache already outperforms other available cache. Didn't wanted to choose best use case for BigMemory i.e. 100% writes NOR the best for On-Heap i.e. Read-only. The read/write ratio is 50% reads and 50% writes. The hot set is that 90% of the time cache.get() will access 10% of the key set. This is representative of the the familiar Pareto distribution that is very commonly observed. The Test loads up full data in the Ehcache and then starts doing r/w operations on it.
These test machine was a Cisco UCS box running with Intel(R) Xeon(R) Processors. It had 6 quad-core 2.93Ghz Xeon(R) cpus for a total of 24 cores, with 378GB (396191024 kB) RAM, running RHEL5.1 with Sun JDK 1.6.0_21 in 64 bit mode.
For BigMemory testcase, had just 2G of java heap even when loading 350 GB of data while for OnHeap testcases, had java heap of twice the data size.

This chart compares the Largest Full GC duration occurred during the full run of the test. The numbers are taken from verbose GC logs.
If you take a microscope, then you can see there is a small green bar beside huge Al-burj tower types red bars. Those are GC duration for BigMemory :). Merely going above 1.2 sec, BigMemory surely kills Garbage Collection and removes the stigma on the Java.

This charts compares the Max Latency during the test run. As expected, this should be equal to the Max Full GC duration, since GC just blocks the application. BigMemory fairly defeats OnHeap here. Anyway who will like to have 4-5 mins of pause in his application, not me atleast !

Lets see how BigMemory throughput behaves with increase in the data size. The chart above shows that after certain point the throughput remains unaffected by the data size. Also, did a run with 350G of data and the tps/latency was constant. (Did we ever thought of caching 350G of data in an application :O). The drop in tps from 512M - 4G of data is because for smaller data size, ehcache stores the entries on heap (remember test is 10% hotset, so till hotset is on Heap & SMALL enough to fit, its faster). And we don't have much GC occurring for smaller data size.

Latency, the most worried about factor for user experience. We don't want our users to wait for 5 secs, because first impression is the last impression. The charts show the mean latency for the tests. Note that all those numbers are in micro-seconds. So they are anyway less than 0.5 secs, meeting your deadliest SLAs. BigMemory wins undoubtedly.

Here comes biggest test for BigMemory. Why will someone use BigMemory if it doesn't performs good enough as On Heap. We can't just ignore throughput for latency. We can see the BigMemory throughput numbers outperforms On Heap numbers here also. On-Heap throughput just goes on decreasing as full GCs would be killing the test. Imagine pausing for 4 mins during the test, will surely reduce the average throughput significantly.
Note: The test which I ran is 50% writes, so we might be overshadowing the onHeap throughput but 10% writes throughput were also comparable.

Mean latency graphs also says the same story which I have been saying all over my blog. BigMemory outperforms OnHeap :)
Do-it-yourself: Here is the svn link to the test, a Maven-based performance comparisons between different store configurations.
Note: You will need to get a demo license key and install it as discussed above to run the test.
So bottom line:
If you are fed-up of GCs, check BigMemory.
If you want to cache 350GB of data, check BigMemory.
If you want to use most AWESOME java cache ever made, check BigMemory.
If you like the post, vote it up on dzone. :)


